AI delivers exactly what you ask for. Just not what the business needs. The models work. What breaks is leadership discipline around what AI should deliver, who owns that delivery, and how you’ll know when value drifts off course. Companies spend more on AI, run great pilots, and still struggle to see real change. Most AI initiatives never make it from pilot to production. The difference is whether leaders govern AI as a living business product.
Three Critical Measurement Failures in AI Projects
Misaligned Success Metrics at Proof-of-Concept: Over 80% of organizations struggle with poor data readiness and unclear KPIs during PoCs. While technical teams optimize for accuracy and F1-scores, business leaders question actual value delivery. This disconnect proves fatal at the PoC-to-production transition, where 42% of companies abandon initiatives despite technical feasibility, unable to demonstrate clear business impact.
Silent System Degradation: AI systems fail gradually and invisibly. Unlike traditional software with immediate error alerts, models decay as data distributions shift and behavior patterns evolve. A 2% hallucination rate quietly grows to 8% over six months. Token costs double from context bloat. Customer satisfaction drops 15 points before anyone notices. By the time business metrics reveal these problems, remediation becomes expensive and complex.
Fragmented Stakeholder Perspectives: CFOs, product leaders, engineers, and compliance officers each need different KPI views. Without unified dashboards, contradictory conclusions emerge, slowing decisions and preventing the rapid course-correction that defines successful AI organizations.
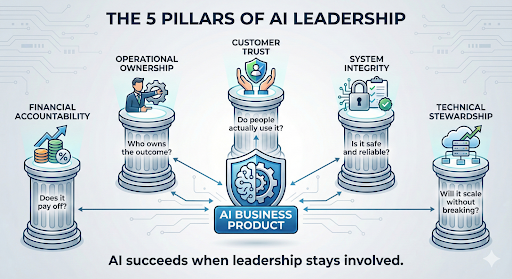
The 5-Point AI Leadership Framework
Winning with AI requires leadership that balances five dimensions at once: financial accountability, operational ownership, customer trust, AI system integrity, and technical stewardship. This is the 5-Point AI Leadership Framework. It’s a leadership discipline, not a dashboard template.
1. Financial Accountability
Treat AI as a capital allocation decision. Where does this initiative show up in the P&L, balance sheet, and cash flow? On what timeline?
Own the total cost of ownership and return. That includes infrastructure, data engineering, governance, human review, and change management. Map those costs against cost avoidance and incremental revenue. When this lens is missing, token and infrastructure costs creep up. AI initiatives lose budget battles to projects with clear ROI. What began as a strategic bet became an expensive experiment.
2. Operational Ownership
AI only creates value when it changes how work gets done. Embed AI into core workflows. Not in pilots or sidecar tools.
Ask: what has changed in cycle times, throughput, and error rates? Look at customer service, sales, HR, IT operations. Measures like call deflection, first-contact resolution, deal velocity, recruiting cycle time, and ticket automation become the scoreboard. When this dimension is ignored, you end up with sophisticated prototypes that never reach production. You get AI activity but no structural uplift in performance.
3. Customer Trust and Adoption
Technically working AI that users bypass is a leadership failure. Success isn’t deployment. It’s whether customers and employees choose the AI path as their default.
Demand visibility into adoption rates, satisfaction, effort scores, and workaround behavior. How often do users revert to manual processes, ignore recommendations, or seek human help? High feature rejection or workaround rates are early warnings that trust is eroding, even when technical metrics look healthy.
Key Customer Metrics and Business Value:
Net Promoter Score (NPS) measures loyalty and advocacy. Target NPS > 40 signals healthy product-market fit; below 20 indicates fundamental issues requiring intervention. Declining NPS despite stable technical metrics suggests capability drift or changing expectations. Business value: NPS directly correlates with customer retention and lifetime value, leading products achieving 50+ NPS demonstrate 10-15% higher retention rates.
Customer Satisfaction Score (CSAT) captures transaction-level sentiment immediately post-interaction. Target 4+/5 or 8+/10. Declining CSAT combined with stable accuracy suggests user experience frustration is accumulating—a leading indicator of feature rejection. Business value: Organizations maintaining CSAT above target thresholds see 19% higher customer satisfaction while reducing support escalations by 20-30%.
Customer Effort Score (CES) predicts loyalty better than satisfaction alone. Target CES of 2-3 (very easy to easy) on a 1-7 scale. CES > 5 indicates AI creates friction rather than reducing it. Business value: Reducing customer effort by one point can increase willingness to repurchase by 94% and reduces churn by up to 25%.
Adoption Rate reveals actual usage versus intended usage. High adoption (>70% of target users actively engaging) signals strong product-market fit. Low adoption (<30%) indicates usability barriers or trust issues. Business value: Every 10% increase in adoption translates to proportional increases in ROI realization and operational efficiency gains.
If this dimension is neglected, you end up in a dangerous place. AI systems are live, costs are real, but value is theoretical because the human system has quietly voted no.
4. AI System Integrity
Reliability, safety, and governance are board-level concerns, not just engineering concerns. Hallucinations, bias, and model drift are business risks. They translate into wrong advice, unfair outcomes, regulatory exposure, and reputational damage.
Ask for continuous evidence that AI systems operate within agreed guardrails. Track hallucination levels, bias and fairness metrics, drift detection, and review processes. When this lens is missing, AI systems degrade slowly and invisibly. Response quality erodes, costs rise, and risk accumulates until it surfaces as customer complaints, compliance issues, or operational incidents that are far more expensive to repair than prevent.
Core AI Functional Metrics: Unlike traditional software that breaks visibly, AI deteriorates silently. Accuracy erodes, hallucinations multiply, biases surface, while systems continue running. Monitor these health indicators:
- Hallucination Rate (<1-2% for critical systems)
- Response Relevancy (85%+ target)
- Drift Detection for inputs and predictions
- Safety Guardrail Performance and bypass attempts
- Bias and Fairness Metrics for regulated applications
5. Technical and Infrastructure Stewardship
See infrastructure as an economic and experience engine. Resilience, scalability, and cost control are leadership responsibilities because infrastructure failures show up first as customer frustration and financial leakage. Insist on business-readable views of technical health. Track latency against user expectations, error rates versus commitments, cost per AI interaction relative to value, and freshness of underlying knowledge and data.
Critical Technical Performance Areas:
Model Inference Throughput measures system capacity to handle concurrent requests (requests per second). Maintain 30%+ throughput headroom above peak demand to absorb spikes without degradation. When headroom drops below 20%, user experience suffers through increased latency and timeouts. Business impact: Inadequate throughput directly translates to lost conversions, abandoned sessions, and revenue leakage during peak periods.
Data Pipeline Freshness determines knowledge currency in RAG and knowledge-based systems. Track knowledge base update frequency and average content age. For rapidly changing domains (compliance, products), content older than 30 days risks outdated information and incorrect recommendations. Business impact: Stale data leads to wrong answers, eroded trust, and potential compliance violations in regulated industries.
GPU/Compute Utilization reveals infrastructure efficiency. Target 70%+ utilization for efficient resource use; below 30% indicates over-provisioned infrastructure burning capital. Track cost-per-inference trends, rising costs without corresponding value gains signal optimization opportunities. Business impact: A global telecom reduced monthly compute costs 42% (from $200K to $116K) through utilization optimization and dynamic model routing.
Ignoring this dimension leads to brittle systems that buckle under peak load. Token and compute costs quietly outrun value. AI experiences become slower and less reliable just as adoption finally scales.
Walmart’s Supply Chain AI
Before the framework became theory, Walmart proved it in practice.
Walmart deployed AI across its global supply chain. The hardest part was ensuring leadership aligned across finance, operations, customer impact, system integrity, and infrastructure. Then holding that alignment as the system scaled across markets like Costa Rica and Canada.
Executives tied AI to clear financial outcomes: less waste, fewer markdowns, and reclaimed labor hours. Supply chain leaders owned it operationally, embedding AI directly into replenishment and routing workflows. Customers never saw the AI, but they felt it through fresher groceries, better availability, and faster fulfillment. Guardrails, human overrides, and audit trails protected system integrity, while scalable, cost-efficient platforms ensured reliability at peak load.
The lesson: Walmart treated AI as a governed business product, not a one-time rollout. That’s why it scaled and why most AI efforts don’t.
AI Projects to Governed AI Products
These five lenses, taken together, shift AI from project to product. A managed asset with clear performance expectations and defined owners across financial, operational, customer, AI health, and technical dimensions.
As organizations mature this discipline, they move from reactive firefighting to proactive value realization. Higher conversion from pilot to production. More predictable ROI. Fewer unpleasant surprises in cost, risk, or customer experience.
Key Takeaways
The competitive advantage in AI comes from unified governance that creates three critical capabilities:
Early Warning Systems: When hallucination rates spike before customer complaints arrive, your team corrects course instead of managing a crisis. Organizations with unified KPI frameworks detect issues 1-2 weeks after emergence rather than months later through declining business metrics.
Value Transparency: Every stakeholder views the same data, translated into their relevant language, dollars for CFOs, customer metrics for product teams, technical metrics for engineering. This eliminates the fragmented perspectives that slow decisions and create political friction.
Accountability Automation: Clear KPI ownership across all five dimensions creates natural incentives for continuous optimization rather than siloed improvement of individual metrics. Organizations implementing structured AI governance achieve 3-4x higher project success rates (from 12% to 35-40% reaching meaningful production value) and 2-3 months faster time-to-production.
The payoff is quantified: Organizations with mature AI governance achieve average ROI of 4.3:1 over three years, 20-30% lower infrastructure costs, and 40-50% reduction in customer-reported AI issues compared to those using ad-hoc measurement approaches.
Chasing the newest AI models won’t determine who wins the next decade. The differentiator will be leadership teams that can monitor and adjust AI performance across five dimensions as conditions change.
That’s the discipline most organizations are still learning. And it’s the difference between AI pilots that impress and AI deployments that transform.